Why are digital marketing statistics important?
We know we need to prove the point of our work with digital marketing statistics, but here are a few other reasons why making  data-backed decisions in marketing is so important:
- Statistics help you prioritize your efforts. If you’re implementing a multi-channel marketing strategy, you’ll want to know how certain platforms will perform compared to others. With statistics to back your choices, you’re able to know what channels might require more resources over others.
- Digital marketing statistics help you stay competitive. With these data points, you’re able to know what others are doing—which can help you jump ahead of your competitors.
- Stay on top of trends. Data reveals patterns and digital marketing trends that can help you to identify strategies and platforms where it might make sense to be an early adopter.
- Data can make room for other strategies. When you’re leveraging digital marketing statistics, you have full confidence in what’s going to work. That way, you can spend less time sweating your strategy and focus on other tasks, like auditing your website! After all, your digital marketing efforts will be fruitless without a strong website.
2022 digital marketing industry statistics
Get a birds’ eye view of the digital marketing industry with these FAQs and stats.
How big is the digital marketing industry?
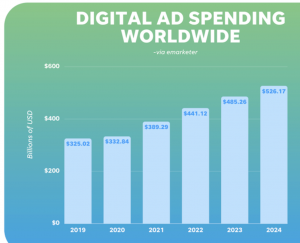
- The global digital advertising and marketing market
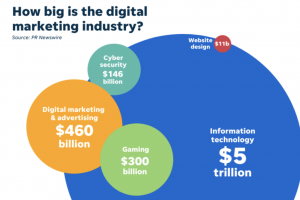 was estimated at $350 billion in 2020 and is projected to reach $786.2 billion by 2026.
 - The U.S. digital advertising and marketing market is currently estimated at $460 billion.
What is the growth rate of digital marketing?
- The compound annual growth rate of digital marketing from 2020-2026 is projected at 9%.
- Digital display is projected to grow at a 15.5% CAGR, while search is projected to grow at 12.2%. Search accounts for 40.9% of the global digital advertising and marketing market.
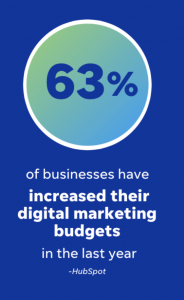
- 63% of businesses have increased their digital marketing budgets just this past year.
- Between 2020 and 2021, there was a 14% growth rate in digital marketing budget spending across businesses.
What is the success rate of digital marketing?
There is no one-size-fits-all answer to this question, but here are some stats to help point you in the right direction.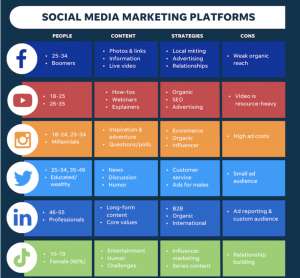
- PPC returns $2 for every $1 spent—resulting in a 200% ROI rate.
- Paid ad channels with the highest reported ROI rate are Facebook Ads and Google Ads.
- 49% of businesses say that organic search brings them the best marketing ROI.
- Email marketing returns $36 for every $1 spent.
- Small businesses claim that email marketing is the marketing channel that brings them the highest return on investment.
- Over 20% of businesses say that the number of leads generated is the primary factor they base the success of their marketing channels.
- Content marketing and SEO provides the best ROI according to marketers in this Databox.
What percent of marketing is digital?
- 72% of overall marketing budgets get put towards digital marketing channels.
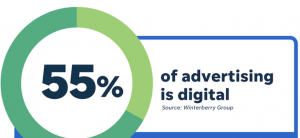
- 55% of marketing is digital. Total digital advertising spend in 2021 was $436 billion versus offline advertising at $196 billion.
Is digital marketing in demand in 2022?
- According to the Bureau of Labor Statistics,
 marketing job demand is set to increase by 10% by 2026—above the average for all careers.
 - Customer marketing managers and search marketing managers are both in CNBC’s list of the 10 fastest-growing jobs in the US in 2022
More digital marketing statistics
-
- The average local business puts
 5-10% of its revenue towards its digital marketing budget, but for larger businesses, that number can climb to about 14%.
 - People spend 50% more with businesses that regularly respond to reviews.
- 93% of people read online reviews before making a purchase.
- Consumers can spend up to 5x longer on a site once they’ve interacted with bad reviews.
- The average local business puts

 317-289-4965