 317-289-4965
First of all……..GREAT movie(s)!  Anything with DeNiro and Crystal in it and you know it has to be good.
These movies have nothing to do with this post……..except for the Titles, but worth watching…….if you’re looking for a good laugh.
In this day & age, it is amazing to me that more businesses don’t use the FREE Google Analytics tool to help manage their website’s traffic and visitors. In my experience, over 75% of our future clients have heard of Google Analytics, but have no idea how to place the pixel and/or how to use it to make more money.
It’s something that we insist on……..once we decide to do business together. Because (as I always say), you don’t know—–what you don’t know. If you don’t know WHO is visiting and <as importantly> WHY they are visiting, then how do you know how to market to them.
So <below> is a ‘SNEAK’ peak behind my madness of utilizing Google Analytics.
This beginner’s guide to Google Analytics will provide an overview of how this tool works, what it can do, the key terms you need to know and how it can benefit your business by informing your future decisions.
How Does Google Analytics Work?
Google Analytics  works via a piece of Javascript code placed on every web page the business wants to measure. If you have an admin account in your website’s Content Management System (CMS), it’s easy to install the Analytics tag following Google’s instructions, or you can ask your developer to help.
When a user visits the website, the code collects various data, including the HTTP request of the user, the browser they use and the first-party cookies they agree for you to collect. This may sound complicated, but essentially, this data is used to provide insight into user demographics and behaviors, such as their language, location, age and gender. The code sends this data to Google Analytics, which aggregates it into four levels:
- User Level (the actions of each user)
- Session Level (the individual visits)
- Pageview Level (the individual pages visited)
- Event Level (video views, button clicks and similar actions)
The aggregated data then appears in the various dashboard reports.
Once the Analytics tag has been added to your web pages, this process will take place automatically, leaving you to focus on reviewing and analyzing the data collected.

Key Terms You Should Know
First-time users of Google Analytics may feel overwhelmed by the sheer amount of data at your disposal. Where do you start? What do all the tables and metrics mean? Having a good grasp of the fundamental terms will help you navigate the platform and makes it easier to follow Google’s guidance. This list is far from exhaustive, but it contains the key terms you’ll need to get to grips with Google Analytics.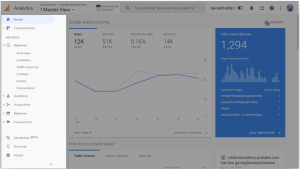
Acquisition: Acquisition is the number of users coming to (and the sessions taking place on) your site. If acquisition increases month on month, for example, it means that more users are coming to your site (or existing users are coming to your site more often).
Channel: All traffic coming to your website is grouped into a source, or channel. These channels are Organic Search, Direct, Referral, Paid Search, Social, Affiliates, [Other] and Display.
Let’s look at these in more detail:
- Organic search: Organic search traffic is all traffic that comes via a search engine (such as Google, Bing and Yahoo!). If a user conducts a search, whether for your brand name or a keyword you’re targeting and ranking well for, and this user clicks on your website from the Search Engine Results Pages (SERPs), they will be grouped into this channel.
- Direct: Direct shows you the traffic coming directly to your site by typing in your URL into the search bar. High levels of direct traffic indicate a healthy brand awareness and may be traffic that has seen a traditional advertisement of your business in a newspaper or on the television, or loyal users who have previously purchased from you and come back to you time and time again to restock.
- Referral: This is traffic that comes to your website from any website other than a search engine (organic). If you publish an article on a website that includes a backlink to your site and a user clicks on the link to go to your website, they will be classed as referral traffic.
- Paid Search: Paid search traffic is traffic from paid advertisement campaigns, such as Google Ads. It’s important to note that paid social traffic may not always align with the clicks you see from within Google Ads. This can be due to several factors, such as whether you’re also running Microsoft Ads (Bing), as Google Ads won’t track this traffic, or whether some paid traffic is being misattributed into another channel.
- Social: The social channel groups any traffic that comes via a social network, such as Facebook, Twitter, Instagram, LinkedIn or Reddit. This channel includes only organic clicks from the platform to your website (such as via a link in a post) — traffic from LinkedIn Ads, Facebook Ads or any other paid social campaign will not be attributed to this platform.
- Affiliates: The affiliate channel helps you see clicks to your website via an affiliate link. Affiliate marketing works by offering relevant businesses or publications (an affiliate) a unique link pointing to your website. The affiliate then earns a percentage of the total sales resulting from that affiliate link. Affiliate marketing is a valuable marketing strategy that increases your reach and lets you leverage established audiences for a small cut of your profits. Monitoring affiliate clicks in Google Analytics lets you pinpoint the best-performing affiliates.
- [Other]: [Other] traffic is any traffic that cannot be attributed to another channel. [Other] traffic often makes up a tiny percentage of overall traffic and is largely negligible. However, if you’re seeing large amounts of [other] traffic, there may be an issue with your attribution model; it may be, for example, that Google Ads traffic is being misattributed to [other] rather than paid search.
- Display: Display ads are a form of paid traffic that shows banners promoting your business to users across the internet. The display channel, then, shows all clicks on ads shown across the Google Display Network, which websites can register to be a part of.
Conversion: If goals are set up in Google Analytics, a conversion is recorded whenever someone completes a goal. This could be making a purchase or downloading an eBook.
Page Views: This shows you the total number of pages viewed by all visitors (this is not the number of visitors or users).
Sessions (formerly “visits”): This tells you the total number of sessions — or individual blocks of time spent by users. If a user is inactive for 30 minutes or more, the session will be deemed finished. If this user then returns after the session is over, a new session will begin. As a result, you will often see more sessions than unique visitors, as some users will return to complete multiple sessions over a period.
Unique Visitor: Every visitor to your site has their own IP address and is, therefore, unique. If a user comes to your site multiple times during a month, each visit will be treated as a separate session, but they will not contribute to the unique visitor count.
Hits: When a page is viewed on your site or a user completes an event, a “hit” is registered in Google Analytics.
Event: Event tracking lets you track interactions with your content. This can be used to track views of an on-site video (and the percentage of those who watched it until the end), clicks on a call to action or downloads of a PDF, for example.
Bounce Rate: A bounce is recorded every time a user leaves your website without interacting. Bounce rate is not only an indication of visitors who land on your website and immediately “bounce” off; a user may be highly engaged and spend seven minutes reading a blog post, but if they read your post and then leave without clicking on another page, Google Analytics will register the visit as a bounce.
Bounce rate, then, is a percentage of all users who leave without interacting with you. To reduce your bounce rate, look at each page and consider whether it meets users’ needs and compels them to take action. Add engaging calls to action to pages with a high bounce rate to specify the action you want them to take.
Pages Per Session: This the average number of page views across all sessions. You can view pages per session at a total level (across all channels) or drill down into each channel to see how engaged each group of users is.
Average Session Duration: The average session duration tells you how long, on average, users are spending on your site. As with pages per session, you can look at this at a total level or by channel and use this to inform the direction of your campaign. For example, if organic traffic is spending an average of over five minutes on your site, your users are highly engaged and it may be worth investing more budget into this channel to increase your reach and potential for conversions.
Dimensions and Metrics: Google Analytics reports are made up of “dimensions” and “metrics”. A dimension is an attribute of your user, while metrics are quantitative measurements. For example, visitor X’s gender is female (the dimension) and the number of sessions from people of that gender is 10,000 (metric). These are useful terms to understand when creating custom reports.
Benefits of Using Google Analytics
You’re probably beginning to see what a powerhouse of web analytics this tool can be. Even using Google Analytics at the most basic level will deliver a whole range of business benefits, including allowing you to:
- Track and measure your website’s performance and adapt your digital marketing strategy accordingly
- Identify successful marketing activities and plough more resources into these, and weed out campaigns that are not working and redirect resources elsewhere
- Plan an effective content marketing strategy by monitoring the success of individual blogs and articles
- Segment your audience for more targeted marketing campaigns that focus on groups at different stages of the buyer’s journey
- Get additional data, build a complete picture of user behavior and boost remarketing efforts when you link Google Analytics to your Google Ads account
- Identify poor-performing pages and either remove or optimize these to reduce bounce rate and increase conversions.
Google Analytics is a fantastic free tool for tracking the performance of a website, allowing you to make informed decisions about your digital marketing strategy. Once you’ve got to grips with the basics, use your data to increase leads and turbo-charge conversions. When used in conjunction with Google Ads, Analytics also gives you the tools you need to deliver awesome PPC campaigns. Analytics is a must-have digital marketing tool for any business.
Bullseye Marketing Group has the experts that help identify how a business can grow and improve its digital marketing efforts. Request your free marketing review today and let us help set you on the path to success.